Compass & Gauge Consulting
Business Benefits
See performance clearly
Turn complex data into intuitive visual dashboards that highlight your most important KPIs instantly.
Save time on reporting
Streamline recurring reporting to reduce manual work and reporting errors.
Make informed decisions
Achieve high-level perspective to lead your business with confidence while you reduce the risk of reporting errors.
Core Services
Power BI Dashboards
Custom interactive dashboards built to provide a clear view of performance, with a refresh schedule suited to your data and operational health.
KPI & Management Reporting
Clear, consistent reporting structures that align your management team around the metrics that drive growth and efficiency.
Financial & Operational Analysis
Deep-dive analysis into your data to uncover trends, identify bottlenecks, and support strategic decision-making.
Recurring Reporting
Optimizing workflows by creating a clear view of performance, with a refresh schedule suited to your data to save time.
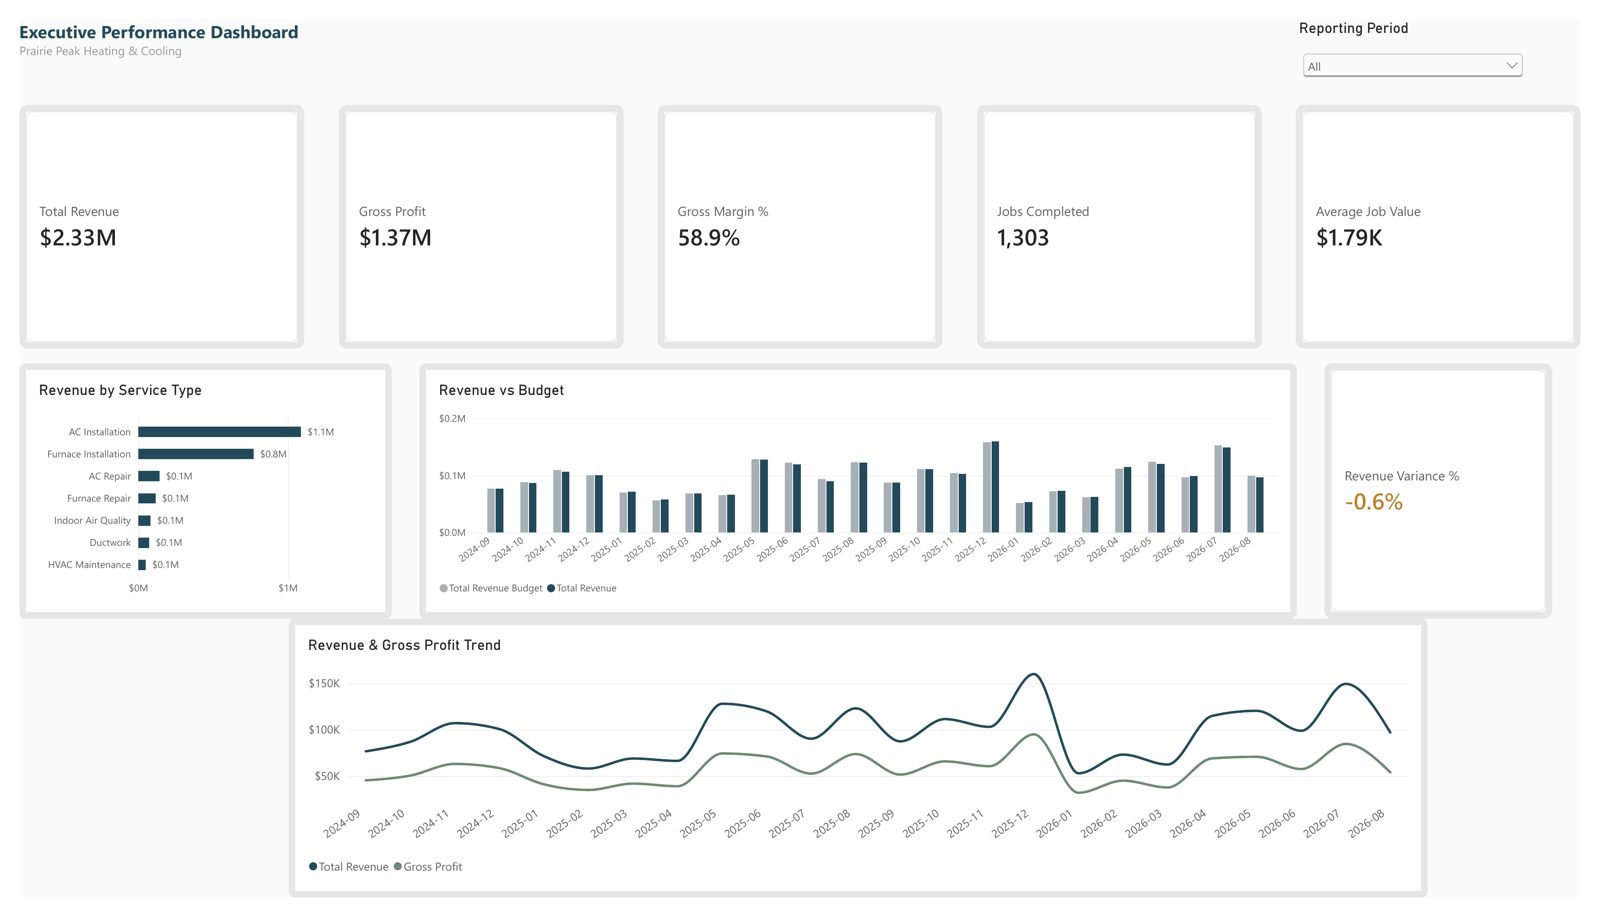
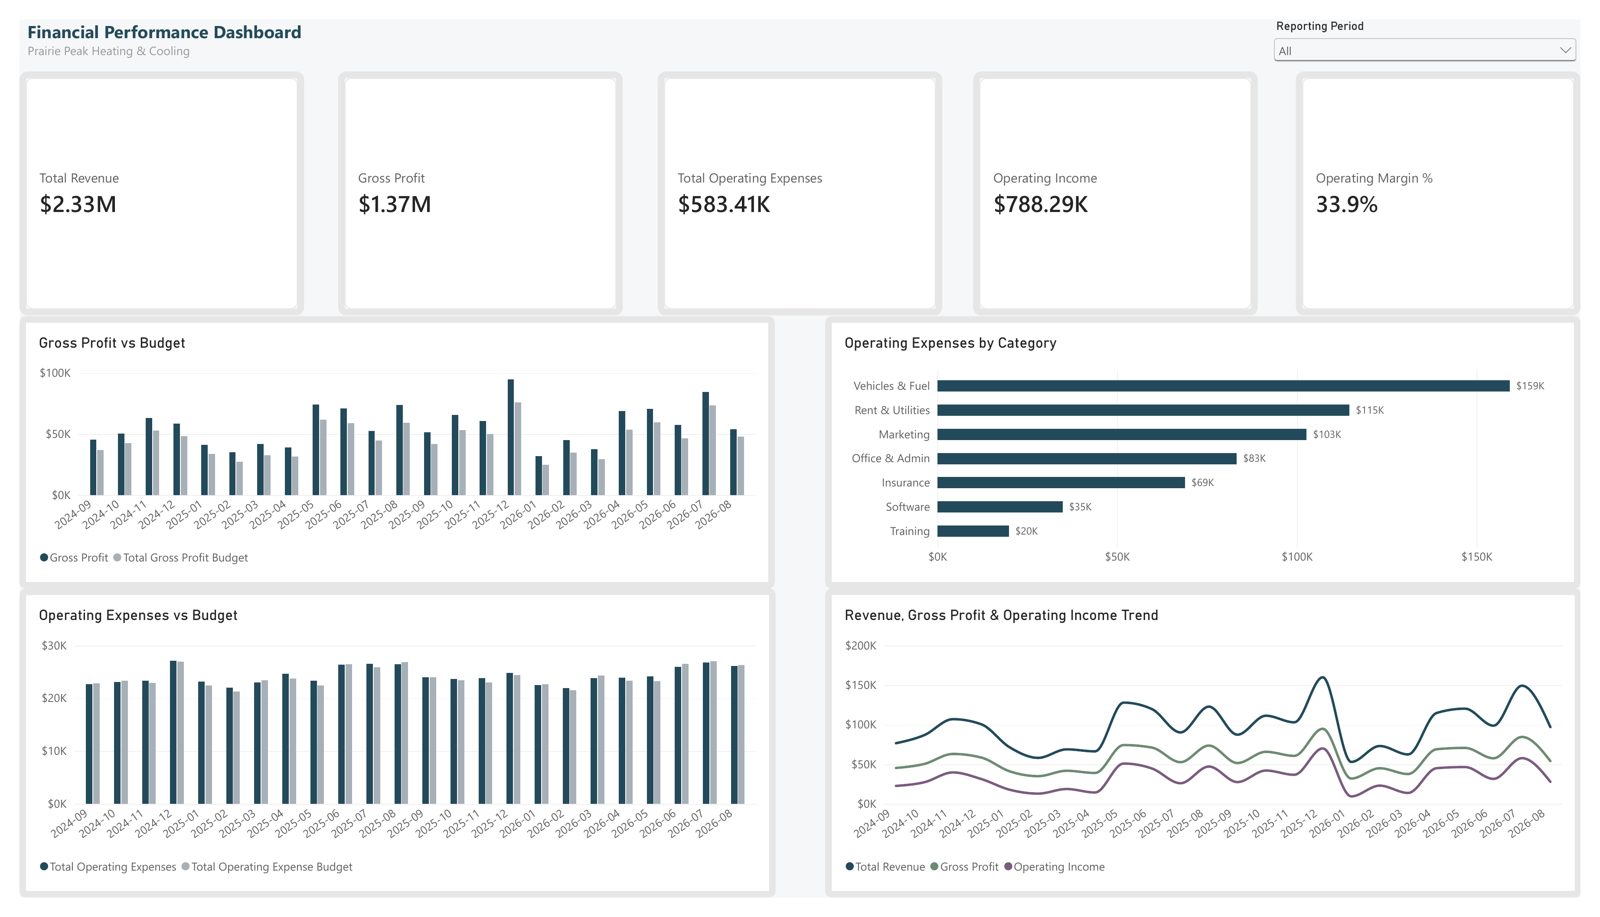
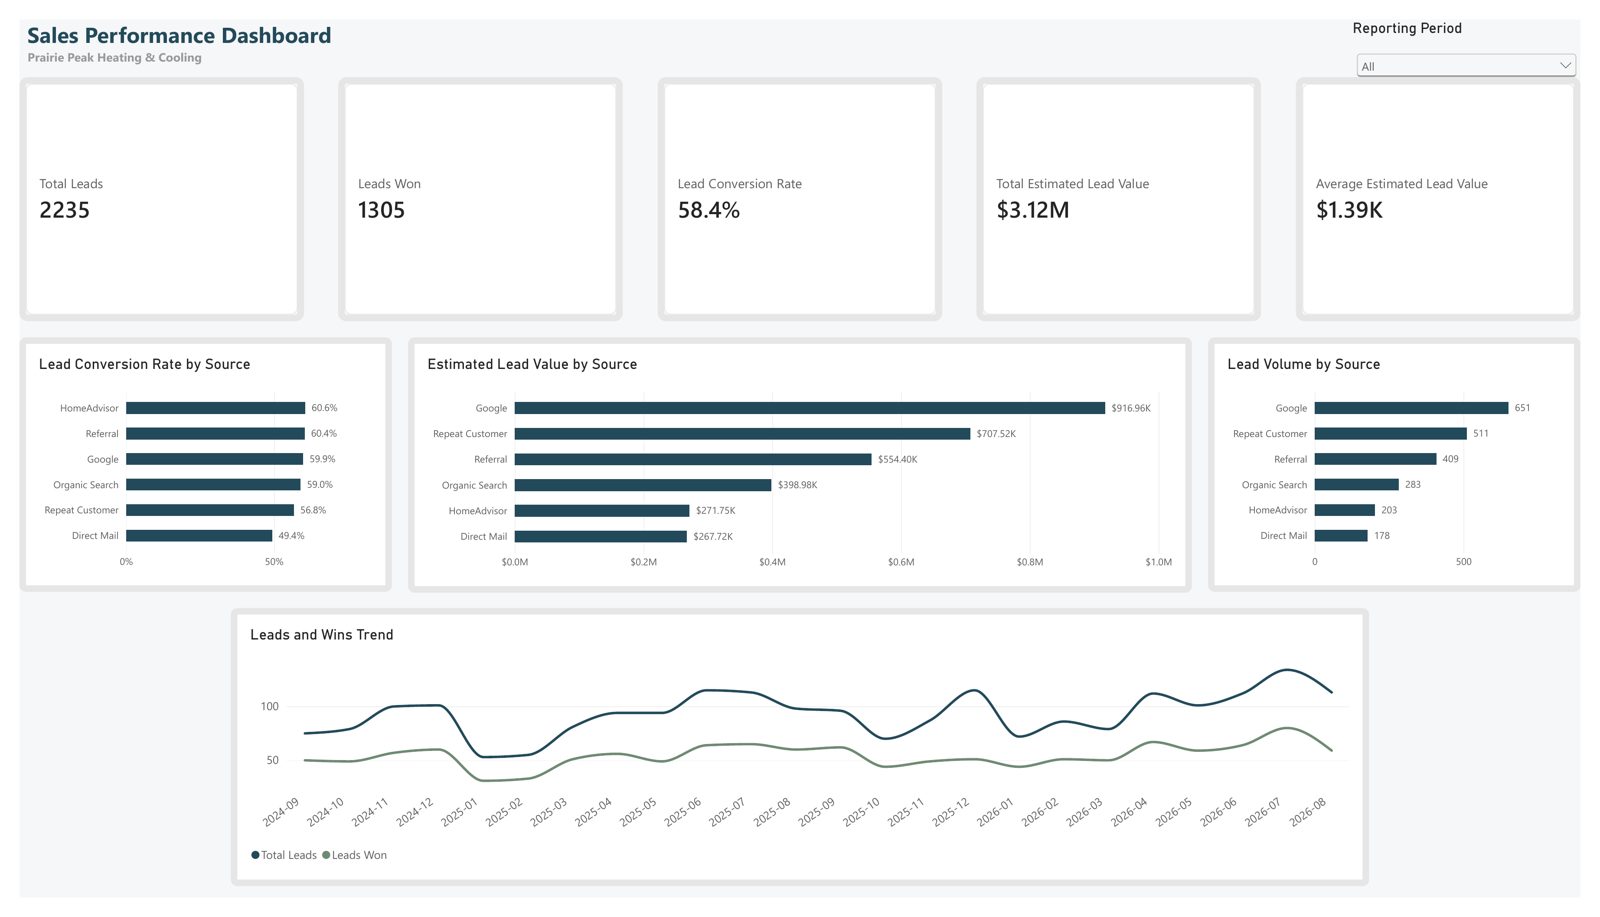
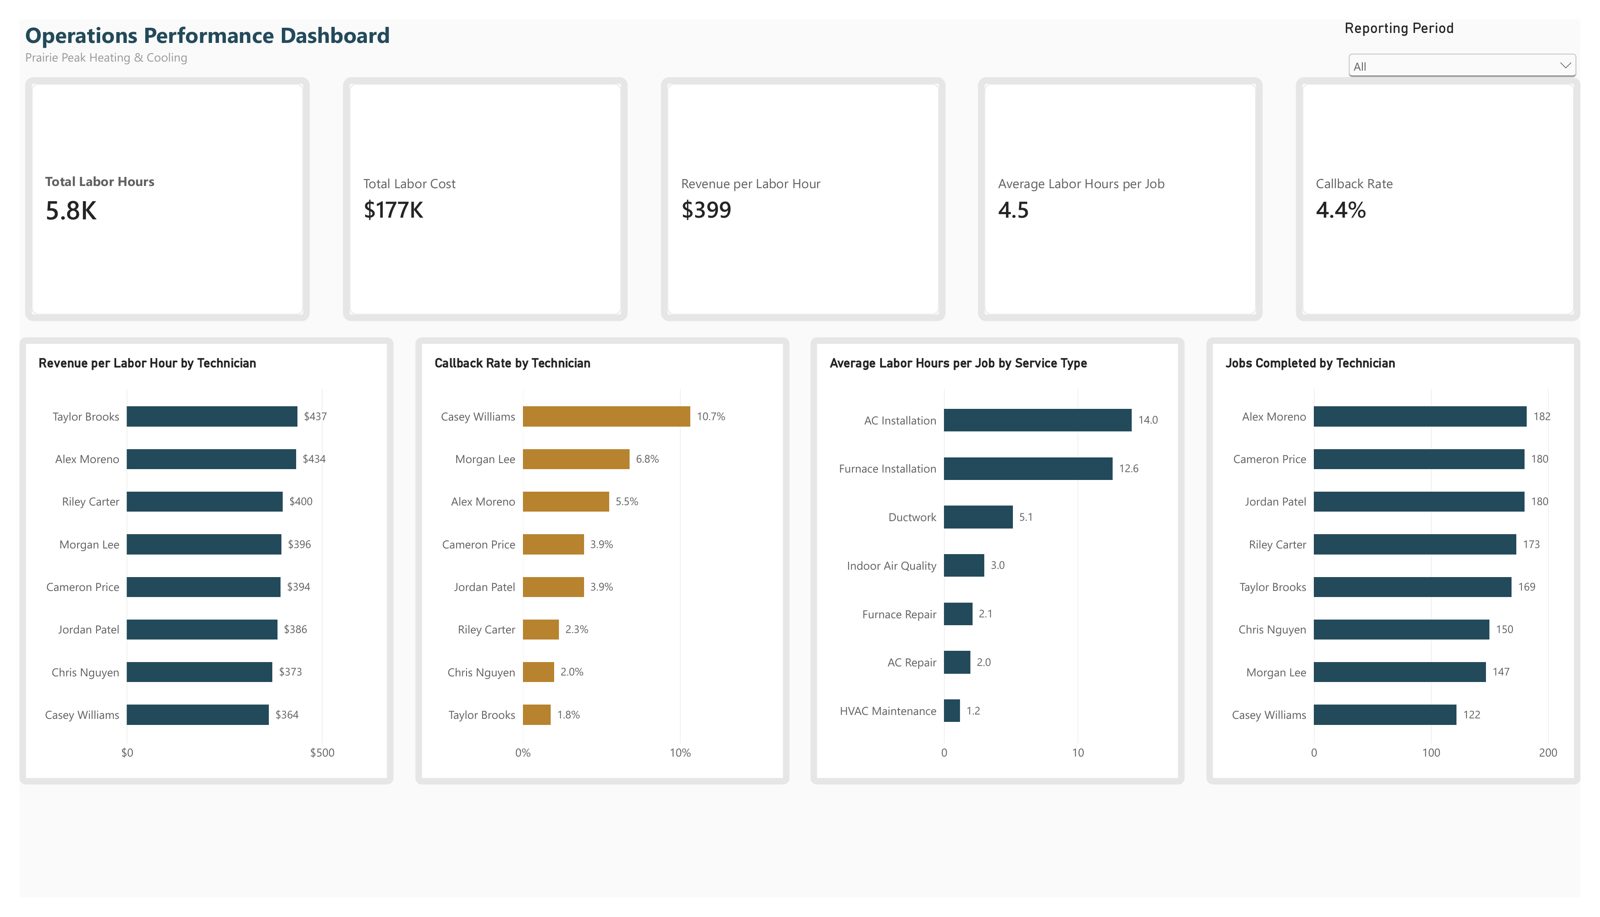
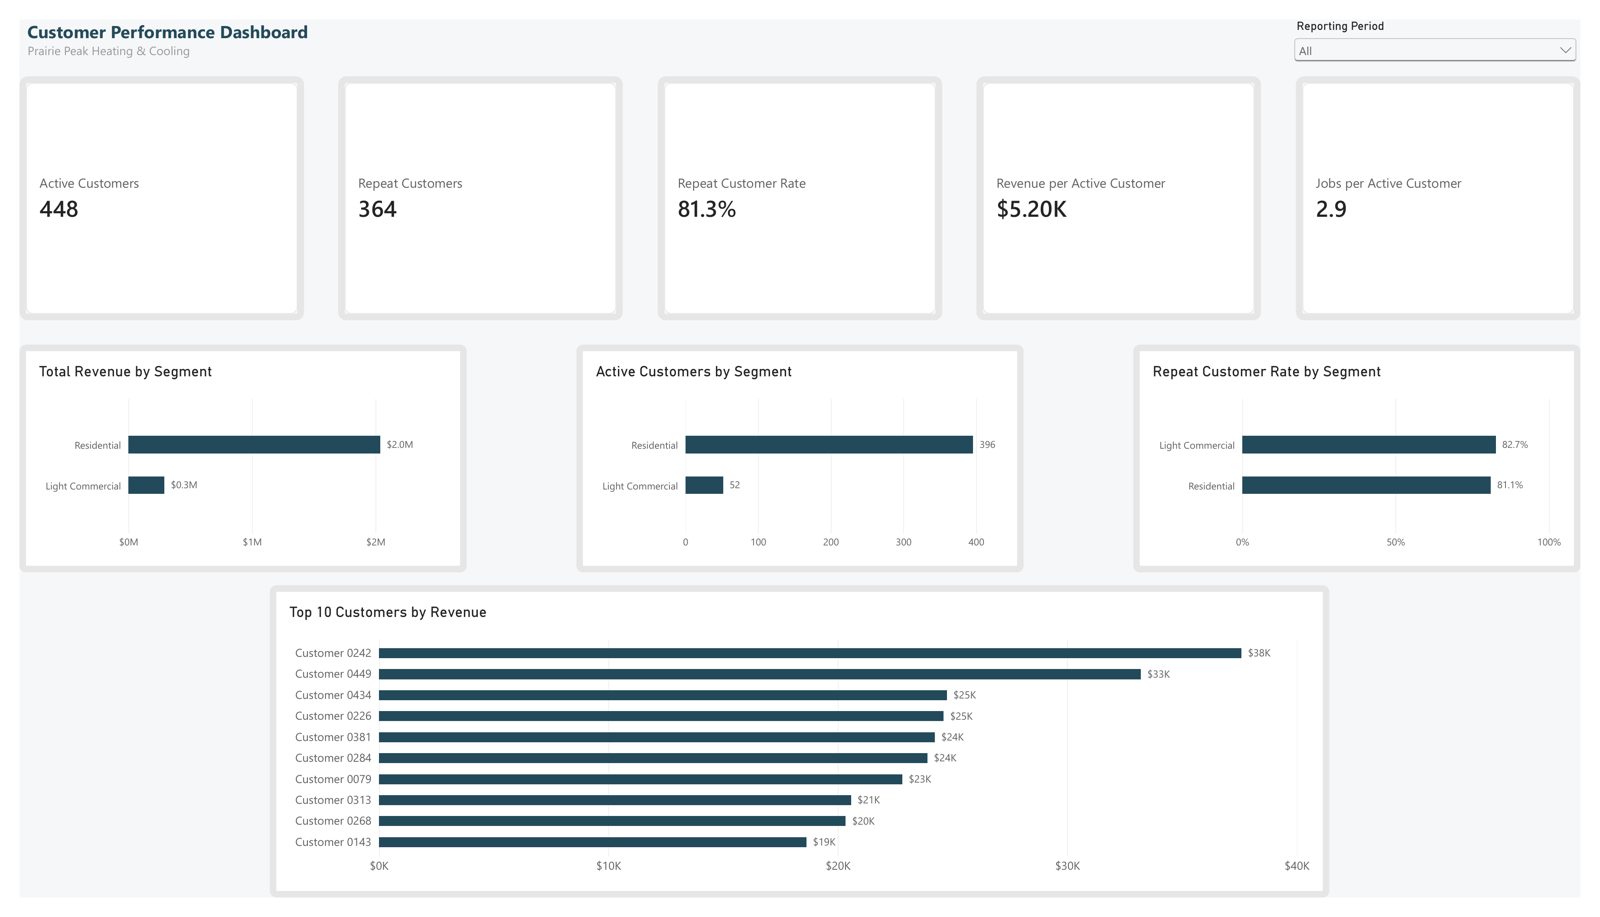
Sample reporting – Prairie Peak HVAC
Prairie Peak Heating & Cooling is a fictional Chicagoland business created to demonstrate our Power BI reporting capabilities using sample data.


Why Compass & Gauge
Practical insights, not theory
We focus on delivering actionable data that solves specific business questions, moving beyond abstract concepts to real-world application.
Reporting built around your business
Your dashboards and KPI sets are customized to your unique operational flow, ensuring that every metric measured actually matters.
Flexible analyst support
Get high-level expertise when you need it most, providing the deep insights of a full-time analyst without the overhead cost.
How It Works
01
Discuss your questions
We start with a conversation to understand your specific business challenges and reporting needs.
02
Organize and clarify your data
We work with your available financial and operational data to organize it into a clear, usable reporting structure.
03
Build and refine reporting
Custom dashboards and management reports are developed to highlight your most critical KPIs.
04
Put insights to work
Utilize decision-ready data to drive strategy and optimize your business performance.